Botanica Gallery
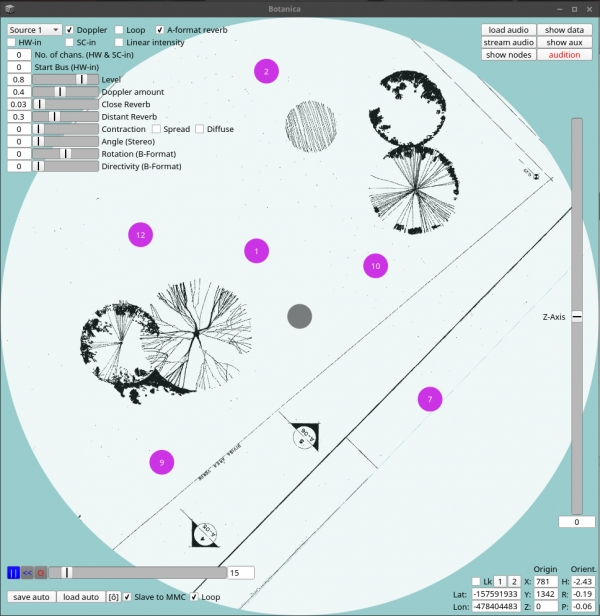
Screenshot of Botanica software (2017). The listener is represented by the central grey dot. The pink dots are the virtual sound sources. As the listener moves through the garden, the map moves in the opposite direction to his or her path with the grey dot remaining at the centre. The pink dots may be stationary on the map or may have their own animated trajectories. As the listener moves, the sound sources move relative to the sliding map. Like real sounds, the virtual sound sources become quieter with distance and they become inaudible once they pass outside the circular boundary of the map. The software is used to perform the mapping of sounds in advance of public interaction and to deliver the 3D sound experience in the field. The software display is not visible to participants.


